
 Substack
Immigration is difficult?! Informing voters about immigration policy fosters pro-immigration views
Immigration is difficult?! Informing voters about immigration policy fosters pro-immigration views
Resources
Authors: Alexander Kustov and Michelangelo Landgrave
Journal: Journal of Experimental Political Science (2025)
DOI: 10.1017/XPS.2024.21
Abstract
The US public is mostly ignorant about basic immigration knowledge. While various attempts to correct misperceptions have generally failed to change people’s minds about the issue, it is possible that this failure has been the result of not providing relevant information. We argue that informing the public about the difficulty of the legal immigration admission process is an effective, perspective-changing way to raise support for more open immigration policies. We test and confirm this hypothesis using a nationally representative US survey experiment (N = 1000) that informs respondents about US immigration’s administrative burdens and restrictions through short verifiable narratives. We also provide the first evidence of the widespread ignorance about the immigration process across diverse political and demographic groups. Our results suggest that providing a better understanding of the immigration process’ difficulty has more promise to change public policy preferences than challenging skeptics’ crystallized beliefs about immigration’s effects or numbers.
Introduction
The American public is not well informed about immigration [@lutz2023misperceptions; @ekins2021pluribus]. Although even experts can disagree on the issue, most Americans hold factually incorrect beliefs about the issue. Americans tend to exaggerate immigrants’ population size [@hopkins2019muted], unfavorable characteristics such as crime rates [@light2020comparing], and socio-cultural differences with the native population [@flores2023immigrants]. Various attempts to change people’s minds on policy by providing information or correcting these misperceptions have been, with few exceptions [@haaland2020labor; @abascal2021intervening; @facchini2022countering; @allen2023communicating], unsuccessful [@hopkins2019muted; @kustov2021stability; @lutz2023misperceptions; @hogue2024does]. It is possible that this has been the result of focusing on beliefs about immigration that are too crystallized [@tesler2015priming] or not providing novel relevant information [@coppock2023persuasion]. Additionally, raising support for increasing future immigration flows may be harder than raising support for helping existing immigrants [@ruhs2013price; @margalit2022against].
Unlike most prior efforts, our study focuses on changing people’s understanding of US immigration admission policy by providing novel information about the difficulties involved in the legal immigration process. We focus on legal immigration because it is the primary means by which migrants arrive to the United States, though future work can also extend our study to irregular migrants (e.g., undocumented migrants and refugees). Beliefs about the immigration process’ difficulty should be relatively malleable to new information because it is a topic that receives little attention and thus where beliefs are not crystallized. We argue that informing Americans about the difficulty of legally immigrating, which many are unaware of, could be an effective way to raise public support for more open immigration admission policies. We then test and confirm this expectation using a large representative survey experiment that informs respondents about the administrative burdens and restrictions of the current US immigration system. We are also among the first to descriptively assess people’s (mis)perceptions about the legal US immigration process in a representative sample. Compared to existing approaches trying to convince skeptics that immigration is or immigrants are good, the results indicate that our approach of giving a new perspective that immigration is difficult has more promise to change people’s policy preferences.
US immigration is a complex policy domain defined by numerous laws and controlled by multiple national and local government agencies with overlapping authority [@tichenor2002dividing; @lee2023subnational]. Even if one only considers federal laws governing the admission of legal family and employment-based immigration, the focus of our paper, the immigration process is “difficult.” The process is both administratively burdensome-the complexity of the process and what it takes to go through it [@Moynihan2022a; @bier2023impossible]-and restrictive-in terms of who is eligible to go through the process in the first place [@peters2017trading; @bier2023impossible]. While we follow public administration literature and differentiate between these two distinct concepts [@halling2022difficult], we are agnostic about which of these elements is more important to people’s preferences.
Given low levels of political knowledge [@achen2016democracy; @somin2016democracy], most people likely have a limited understanding of the immigration process or the burdens involved. As a result, voters may form strong preferences on what the government should do about immigration without knowing what the government already does. Americans tend to assume that their immigration system is much more straightforward and open than it is [@ekins2021pluribus]. One recent poll showed that most voters across parties incorrectly believed that it would only take a few years to receive a green card for a Mexican sibling of a US citizen [@orth2022yougov]. The correct answer of 20 years was given by only 1% of respondents. Strikingly, the vast majority-including Republicans-believed it should only take a few years.
This existing fragmented evidence suggests that people’s misperceptions about immigration policy may be deeper than misperceptions about immigrant characteristics or immigration effects. Consequently, there may also be more room for information to update people’s beliefs about immigration policy to change their preferences than in the case of these other facts. In line with this idea, there is recent evidence that policy-oriented information can change minds about non-immigration policies [@keiser2020does; @nicholson2021administrative; @halling2022difficult; @thorson2024invented] and irregular immigration [@thorson2022misperceptions]. It is important to replicate these findings on the broader domain of legal immigration policies using a representative sample.
Interventions that make existing knowledge accessible should be less effective and durable than information provision interventions that instead make new knowledge applicable [@coppock2023persuasion; @haaland2023designing]. Information interventions should also be more effective for policy persuasion than perspective-taking approaches that are more suited for reducing group prejudice [@abascal2021intervening]. Among possible information interventions, non-judgmental and verifiable narratives [@dennison2021narratives] that can shift people’s understanding of immigration should also be preferable to fact-checking approaches that simply attempt to correct people’s misperceptions about various, often already crystallized, immigration facts [@abascal2021intervening].
We argue that telling respondents about the administrative burdens and restrictiveness of the US immigration process can be such an “eye-opening” information intervention. Importantly, to the extent that such information can successfully change people’s minds, it should work by generating new knowledge or otherwise updating people’s respective empirical beliefs about the difficulty involved in the immigration process. We test the effect of informing the public about the difficulty of immigrating on immigration attitudes using a nationally representative survey experiment (YouGov, N = 1000) [@pulse2023] that informs respondents about administrative burdens and restrictions of the current US immigration system. Specifically, we will test the following hypotheses:
- Receiving relevant information about the difficulty of legal immigration to the United States will increase respondents’ awareness of this difficulty.
- Receiving relevant information about the difficulty of legal immigration to the United States will increase respondents’ support for more open legal immigration policies.
In addition to our experimental results, we also descriptively assess the public’s (mis)perceptions about the US legal immigration admissions process. To do that, we ask our respondents to guess the average waiting time for different categories of foreigners who want to immigrate legally. Since we want to generalize the available evidence about particular idiosyncratic categories [@orth2022yougov], we ask about multiple groups based on their skills, availability of job offers, and familial relationship to US citizens. In particular, the respondents are asked to guess how long it takes for an adult sibling of a US citizen, an aunt or uncle of a US citizen, a doctor without a job offer, a famous athlete or artist, or a nanny with a job offer to legally migrate to the United States (see appendices for the survey instrument).
Methods
We preregistered our study on Open Science Framework (OSF) [note: See https://osf.io/xvh8q and appendix section 4.] and uploaded replication materials on Harvard dataverse [@dataverse2024]. The sample of N = 1000 was collected as a part of a larger omnibus survey by YouGov from May 26 to June 2, 2023 [@pulse2023]. The respondents were matched to a sampling frame on gender, age, race, and education, constructed by stratified sampling from the 2019 American Community Survey (ACS). While all our analyses employed the standard post-stratification weights provided by YouGov, removing these weights does not impact our results.
Based on best ethical practices in experimental political science [@costa2023ethical; @desposato2015ethics; @landgrave2020can], ethical concerns regarding our study are minimal. Respondents provided informed, voluntary, and affirmative consent to participate in the research study and no deception was used. Respondents were never placed in any danger or risk beyond those experienced in routine clerical work. Per YouGov terms, respondents did not receive monetary compensation. YouGov respondents agree to participate in surveys without compensation although they may receive gifts at YouGov’s discretion. Our survey was fielded as part of a larger omnibus survey, the Polarization Research Lab’s America’s Political Pulse Survey, and we did not have control over what compensation respondents did or did not receive. Our research was approved by the Institutional Review Boards of ANONYMIZED INSTITUTIONS.
Pre-treatment, respondents were asked about their factual knowledge of immigration visa policies. Respondents were then randomly exposed to one of the informational [note: Arguably the treatments contain phrases which may trigger negative valence. Future studies should use stimuli sampling [@gigerenzer2022we] to minimize concerns about specific phrasing.] treatments with encouragement to read it carefully. Post-treatment, respondents completed a set of survey items measuring their immigration preferences (main outcomes) and beliefs about immigration difficulty (secondary outcomes which also acted as manipulation checks).
Our two “burdensome” and “restrictive” 150-word treatments built on the publicly available information [@bier2023impossible] about various aspects of the immigration process in a form of an accessible, verifiable, and non-judgmental narrative [@dennison2021narratives]. The burdensome treatment conveyed that immigration application and legal fees amount to thousands of dollars and going through the right process takes many years. The restrictive treatment conveyed that there is a limited number of immigrant visas available each year and that, depending on one’s origin country, some immigrants may not be able to obtain permanent residency for which they are otherwise eligible.
Table: Information Treatment Conditions
\begin{table} \centering \caption{Information Treatment Conditions} \begin{tabular}{@{}p{.25\textwidth}p{.75\textwidth}@{}} \toprule \textbf{Condition} & \textbf{Treatment Text} \\ \midrule Placebo Control & An "immigrant" is a person who comes to a country to take up permanent residence. An "emigrant" is someone who leaves their place of residence or country to live elsewhere. A "migrant" can refer to either an immigrant or an emigrant. "Immigrate" refers to entering a new place; "emigrate" refers to leaving the original place. Migration is defined as a change in a person's permanent residence from one geographical area to another. International migration consists of people changing residence across countries. Net migration flows to a country are calculated as the difference between (1) immigration to that country and (2) emigration from that country during a particular period of time. If a country has negative net migration flows, it means that more people are leaving than entering that country. If a country has positive net migration flows, it means that more people are entering than leaving that country.
\\ \midrule \midrule Treatment 1 (Burdensome) & The US immigration system is complex and burdensome. There are nearly two hundred different visa types, which makes it difficult to know which visa a potential immigrant can apply for, if any. Applying for a visa is also burdensome in terms of money and waiting time. Application fees and legal consultation costs thousands of dollars. The application fee to become a permanent resident is \$1,140 without legal fees. Legal fees for petitioning a spouse of a US citizen to obtain permanent residency, one of the simplest processes, costs around \$3,000. Additionally, the average wait time for a visa appointment is 244 days, and some wait over two years. This doesn't include the time it takes to become eligible for a visa, or for application processing (which can take more than a year depending on the visa type). The difficulty, costs, and long wait times of the immigration process makes it impractical for many.
\\ \midrule Treatment 2 (Restrictive) & The US immigration system is restrictive. There is a yearly numerical cap of about 220,000 for family-based visa categories and 140,000 for employment-based visas. This means that, if someone received a job offer from a willing employer after the employment-based visa cap was already filled, they would have to wait until at least the next year before being allowed to try immigrating again. Additional restrictions may apply based on immigrant's country of origin. For example, family members of US citizens from certain countries wait for decades before they can immigrate to become permanent residents. Some foreign workers may also have to wait for decades to obtain permanent residency for which they are otherwise eligible. As of 2022, applicants from the most impacted countries are only now processing applications from the early to mid-2000s because of how restrictive the immigration system is.
\\

\bottomrule \end{tabular} \end{table}
Using simple randomization 1/3 of respondents were exposed to each of the two treatments plus a further 1/3 of respondents were exposed to a placebo condition-a text mentioning policy-neutral facts about immigration. [note: We included a placebo instead of a pure control to ensure all participants engaged with migration-related content, thus isolating the effects of specific policy information while controlling for general topic engagement. This approach arguably allows for a more conservative test of treatment effects.] To minimize measurement error, the survey included multiple previously validated immigration preference items $(alpha = 0.76)$ and novel immigration belief items summarized as 0-1 indices. Given the random assignment, to test our two hypotheses we simply compared the mean values for relevant indices between the combined experimental and the control groups using a standard difference-in-means estimator.
Results
Documenting Immigration Policy Knowledge. Our descriptive results confirm that the US public significantly lacks knowledge about current immigration admission policies, even more so than about immigrant characteristics. Table 2 shows and provides t-tests for subgroup differences in immigration visa policy knowledge across the following dichotomized sociodemographic groups: gender (female vs male), age ($$ 40 vs 40+), race (non-Hispanic white vs non-white), language (Spanish vs non-Spanish speakers), educational attainment (college degree or more vs less than college), income (low vs high), party identification (Republican vs Democrat), and ideology (conservative vs liberal). To make comparisons more general and informative, we test for differences in knowledge about whether the uncles and aunts of a US citizen are eligible for a green card (arguably one of the most straightforward questions in our battery), the average correct across the knowledge battery, and the average correct across the knowledge battery including almost close answers.
Only $81.5%$ of respondents correctly answered that aunts and uncles of US citizens are not eligible for legal family-based immigration. We believed the aunt/uncle question would be the easiest question to answer, but as the data shows relatively few respondents guessed correctly. The average correct response rate across all immigrant admission categories is $25%$, just slightly better than what we would expect from random guessing (20%). Even if we include ‘almost’ correct answers, answers in the same direction as the correct answer, the correct rate only slightly raises to $40%$ (with the correct guess rate by chance of 20%) .
Importantly, our knowledge battery confirms that this lack of knowledge is equally widespread across all major sociodemographic and political categories. Young and old, white and non-white, rich and poor are all ignorant of current immigration admission policies. There is some evidence that college-educated, liberal, and Democrat respondents are somewhat more knowledgeable but these differences of a few percentage points are arguably not substantively important. There is also only a similarly minor difference in knowledge based on respondents’ racial attitudes (see pilot study appendix). These findings further suggest that providing information about immigration policies should be novel for most respondent groups.
Table: (No) Subgroup Differences in Immigration Policy Knowledge. The table shows 95% CI and p values from survey-weighted t-tests for binary subgroup differences. For details, see supplementary material.
\begin{table}[htb] \label{tab:demMINI}

\resizebox{1\textwidth}{!}{ \begin{tabular}{@{\extracolsep{-5pt}}lcccccc} \hline Subgroup & Uncle Eligibility & \textit{P} val. & Average Correct & P val. & Almost Correct & \textit{P} val. \\ \hline \textbf{Sample Average} & \textbf{6.5-10\%} &  & \textbf{24-27\%} &  & \textbf{38-41\%} &  \\ Female & (-0.02,0.05) & 0.482 & (0.01,0.05) & 0.007 & (0.02,0.05) & 0.001 \\ Old (40+) & (-0.05,0.03) & 0.596 & (-0.02,0.03) & 0.704 & (-0.01,0.03) & 0.313 \\ White Non-Hisp. & (-0.08,0.00) & 0.035 & (-0.01,0.03) & 0.454 & (-0.01,0.03) & 0.429 \\ Spanish-speaking & (-0.01,0.11) & 0.109 & (-0.01,0.06) & 0.182 & (-0.01,0.05) & 0.153 \\ College-educated & (-0.01,0.07) & 0.127 & (-0.01,0.04) & 0.314 & (0.00,0.04) & 0.046 \\ High-income & (0.00,0.10) & 0.053 & (-0.02,0.03) & 0.700 & (-0.02,0.03) & 0.527 \\ Republican & (-0.1,-0.01) & 0.01 & (-0.05,0.01) & 0.224 & (-0.05,0.00) & 0.052 \\ Conservative & (-0.09,0.00) & 0.066 & (-0.05,0.01) & 0.263 & (-0.06,-0.01) & 0.015 \\ \hline \end{tabular} } \caption{\textbf{(No) Subgroup Differences in Immigration Policy Knowledge.} The table shows 95\% CI and \textit{p} values from survey-weighted t-tests for binary subgroup differences. For details, see supplementary material.} \end{table}
Effects of Providing Immigration Policy Information. In line with our pre-registered hypotheses and empirical specifications, our main results show that providing novel information about immigration difficulty is effective (see Figure 1 and Table A1). After reading about the current restrictions or their administrative burden, respondents were significantly more likely to believe that immigration is difficult (0.062 on a 0-1 scale or Cohen’s $d$ of 0.27) and report pro-immigration policy preferences (0.066 on a 0-1 scale or Cohen’s $d$ = 0.25). [note: The arguably more precise estimates, calculated after adjusting for pre-treatment covariates were almost identical: 0.058 and 0.067 on 0-1 scale, respectively (see Table A1).] Substantively, this amounts to $116$ percentage-point (28%) more respondents believing that legal immigration is burdensome or restrictive (given the baseline of 40%) and $136$ percentage-point (35%) more respondents preferring to increase legal immigration or make it easier (given the baseline of 35%).
Figure: (Positive) Effects of Immigration Policy Information on Beliefs and Preferences. May-June 2023 Main Study (YouGov, N=1000). This figure depicts the pre-registered hypotheses tests. Bars indicate 95% confidence intervals.
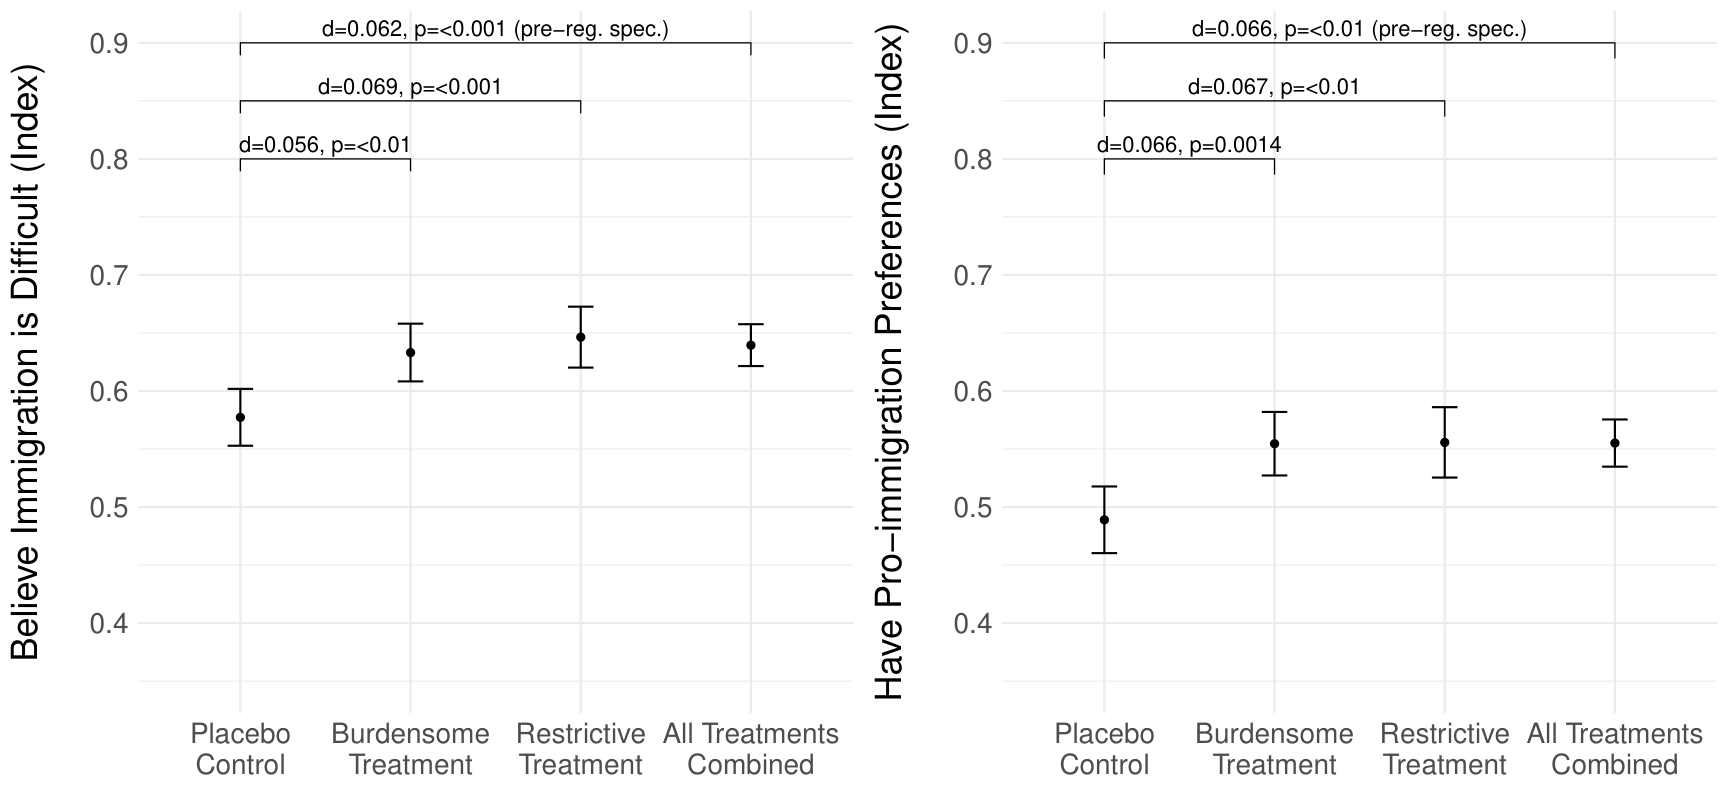
Caption: (Positive) Effects of Immigration Policy Information on Beliefs and Preferences. May-June 2023 Main Study (YouGov, N=1000). This figure depicts the pre-registered hypotheses tests. Bars indicate 95% confidence intervals.
Our additional exploratory analysis suggests that both treatments had a statistically similar positive effect across distinct immigration preference and belief outcomes (see appendices section 2 - additional figures and tables). At the same time, the treatment effects remain the same when we include controls for major pre-treatment covariates (see Table A1). Although our sample size was not large enough to detect small between-treatment differences or interaction effects, the exploratory analysis indicates that the treatment effects were similarly positive for most major political and socioeconomic groupings, including both Democrats and Republicans and across the ideological spectrum (see Tables A2-A5 and Figures A2-A5).
Additional Pilot Results To ensure the project’s feasibility and pretest original items, we also conducted a pilot survey experiment in November 2022 using a large, diverse online sample (US Prolific, N = 912). The pilot study was near-identical in both design and results to the main study. Notably, the Prolific study had a single, shorter preference outcome (preferring increasing immigration) and included a political cartoon of a nondescript person lost in an ‘immigration maze’ with the treatment conditions (see appendices for further information about the pilot study design). The image was intended to emphasize the difficulty inherent in the US immigration system. Despite the exclusion of the image in the follow-up study, the same general results (see Figure 2) are present in the pilot and main studies. That is, after reading about the current restrictions or their administrative burden, respondents were similarly more likely to believe that immigration is difficult (0.072 on a 0-1 scale) and report preferring increasing immigration levels (0.062 on a 0-1 scale). This increases our confidence that our results are not being driven by specific wording and/or imagery alone.
The pilot results also suggested that, even in the relatively liberal and educated Prolific sample, few people were knowledgeable about immigration policy. [note: 49% and 16% of our pilot respondents identified as Democrat and Republican, respectively, and 52% reported completing a college degree.] On average, respondents provided correct answers 32% of the time, slightly above the 20% expected by guessing alone (and above the 25% estimate from our nationally representative sample). Furthermore, similar to our main results, none of the major socioeconomic or political covariates were significantly predictive of immigration policy knowledge (including education, partisanship, and even racial resentment measures).
Figure: (Positive) Effects of Immigration Policy Information on Beliefs and Preferences. November 2022 Pilot (Prolific, N = 912). Bars indicate 95% confidence intervals.
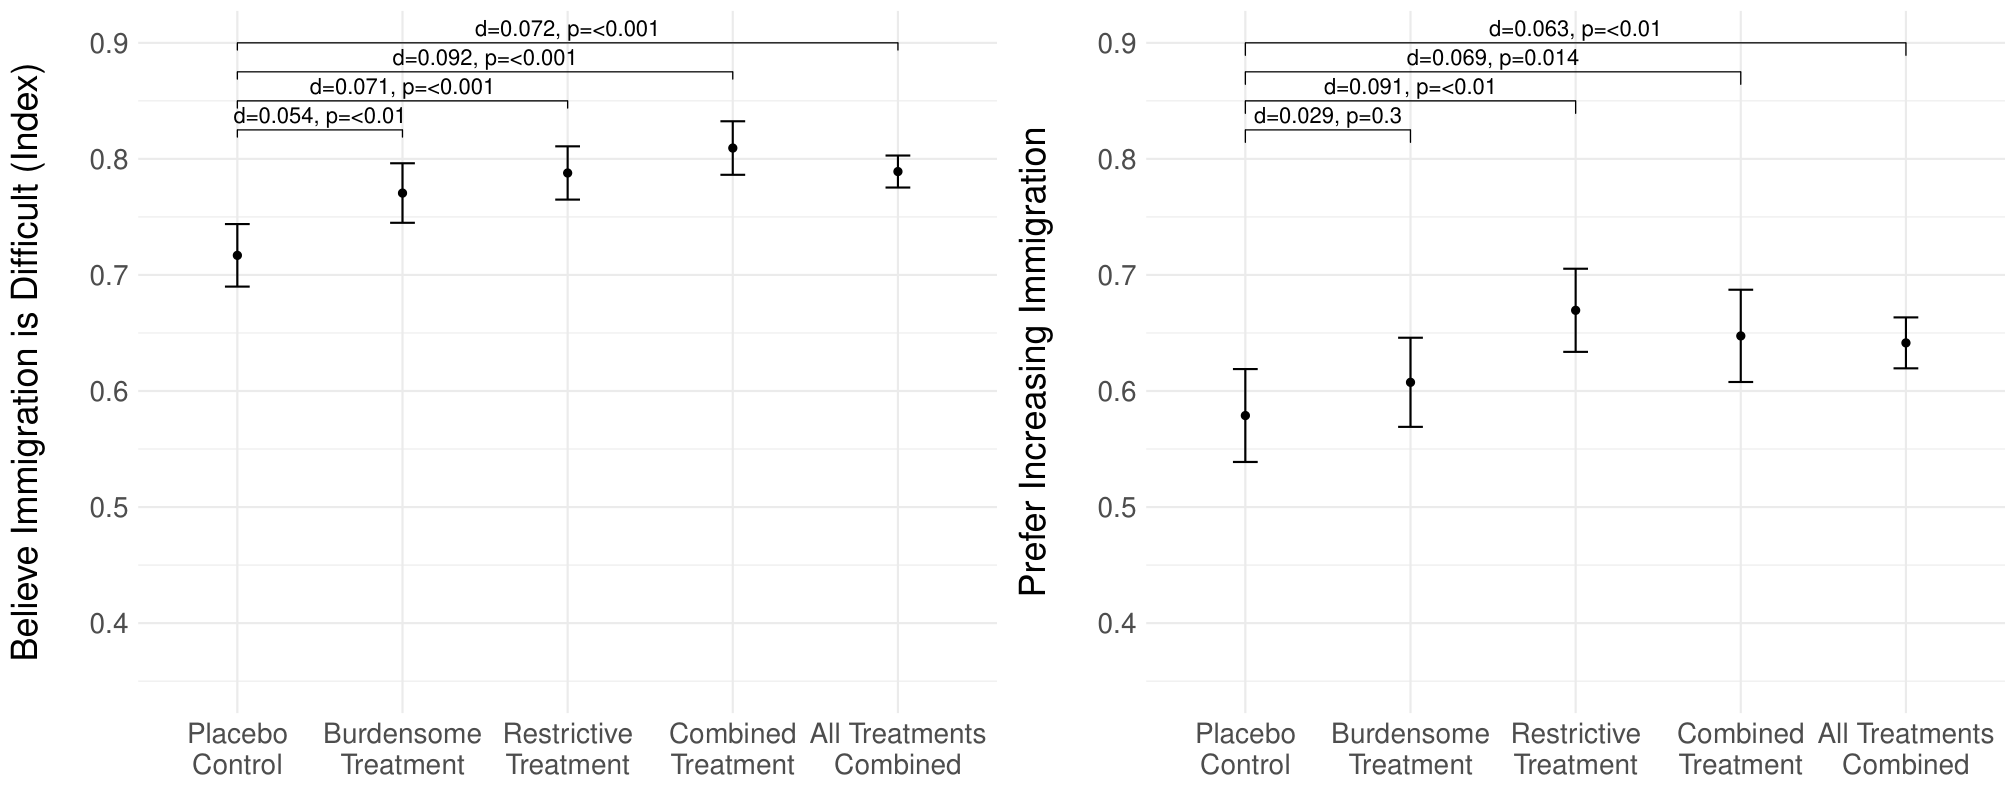
Caption: (Positive) Effects of Immigration Policy Information on Beliefs and Preferences. November 2022 Pilot (Prolific, N = 912). Bars indicate 95% confidence intervals.
Discussion
Many individuals and organizations advocate for more open immigration admission policies, driven by the beliefs and evidence that immigration generally benefits all parties involved and thus should be less restricted. Yet, despite these well intentioned efforts, many voters remain skeptical. While there has been much research on how one can change minds, it is still unclear whether it is possible to persuade voters to support liberalizing legal immigration policies.
We argued that informing Americans about the difficulty of legally immigrating-which many are simply not aware of-could be such an effective way to raise public support for more open immigration admission policies. We then showed that a short factual narrative about immigration policy burdens and restrictions could convince at least some of the current skeptics to reconsider their position on the issue, with about 13 percentage points (or 35%) more respondents displaying pro-immigration attitudes. Importantly, the intervention has successfully changed peoples’ minds by generating new knowledge or otherwise updating their respective empirical beliefs about the difficulty involved in the immigration process. These results are encouraging given that many previous immigration information experiments find that respondents update their empirical beliefs but not policy preferences.
Of course, our findings are not without limitations and there are several extensions worth pursuing. Future research can explore whether the effects observed here are long-lasting or can withstand counter-information or -framing. Our results suggest that providing information about current immigration policies and their difficulty can affect a few percent of voters in the short run, but it is important to acknowledge that immigration attitudes are generally stable in the long run [@kustov2021stability]. Although it is possible that the effects displayed here would be damped in real-world campaigns [@broockman2022and], we are optimistic that an effect would persevere given the relative novelty of the information presented. Ultimately, any robust positive change in policy would also require compromising with those voters who oppose immigration regardless of available information [@helbling2023numbers; @kustov2025].
Future research could explore the relative effect strength of various treatment variations and possible subgroup effects in larger representative samples in the United States or other countries. Stimuli and placebo sampling, using multiple treatments, would be especially helpful in addressing concerns that specific phrases are driving the observed effects. There is suggestive evidence that informational treatments may have differing effects among conservatives, and other demographic subgroups [@chan2023perceived]. There is also evidence that, depending on the policy environment itself, voters in some countries and contexts can be systematically more knowledgeable about immigration and its benefits than others [@donnelly2017canadian; @liao2020local].
Our focus in this manuscript was on changing attitudes toward legal immigration policies. We did not compare (the effects of information about) administrative burdens in immigration to other policies or test whether our informational treatment might also work with other types of immigration or immigrant groups like undocumented migrants or refugees [@thorson2022misperceptions; @bansak2017europeans]. We focus on voters’ attitudes toward legal immigration in particular (as opposed to undocumented immigration or immigration in general as it is common in the persuasion literature) because legal pathways remain the primary means by which the US regulates the long-term admission of non-citizens into the country. Although the US government also has distinct policies concerning irregular migrants, these policies are largely contingent on the number of allowed legal immigrants [@ruhs2013price; @bier2023impossible] We also did not consider how voters’ or migrants’ inter-sectional identities (e.g., based on gender, religion, race, or ethnicity, see [@choi2023hijab]) may moderate our findings. Exploring these and other heterogeneous effects is beyond the scope of the present manuscript.
Finally, several plausible mechanisms could explain our results, even considering the manipulation check evidence of increased awareness of immigration difficulty. The information treatments may alert people to perceived injustices in the current system, leading to support for reform as a means of empathizing with immigrants’ plight [@williamson2021family] or creating a more equitable system aligned with American values [@levy2020immigration]. Alternatively, the treatments might highlight systemic inefficiencies, prompting support for reform to improve functionality and better serve American interests [@kustov2021borders].
We intend to explore these and other extensions in future work. Still, given that the attitudes toward future immigrants may be generally harder to change than toward present migrants [@margalit2022against], our findings carry the potential for wider applicability. Our approach also provides the foundation for a robust research program exploring policy persuasion on immigration and other issues.
We thank seminar participants at the Politics of Race, Immigration, and Ethnicity Consortium (PRIEC), the Junior Americanist Workshop Series (JAWS), the American Political Science Association (APSA) annual meeting, and others for valuable feedback on earlier drafts of this manuscript. All remaining errors are our own.
Data Statement
The data, code, and any additional materials required to replicate all analyses in this article are available at the Journal of Experimental Political Science Dataverse within the Harvard Dataverse Network, at: https://doi.org/10.7910/DVN/SCX187
Conflict of Interests Statement
The authors declare none
Ethics Statement
This research complies with all relevant ethical regulations and with APSA’s Principles and Guidance for Human Subjects Research. The study was approved by IRB at the University of North Carolina at Charlotte and the University of Missouri. Informed consent was obtained from all participants. YouGov compensates participants with reward points that can be redeemed for cash.
Funding Statement
This research was supported by survey space in the Polarization Research Lab’s Partisan Animosity Survey Time Sharing (PASTS).
Source Appendix: r2_appendices.tex
Survey Instrument
{ Policy knowledge} (pre-treatment) [Random ordering of categories, matrix question]
“If the below person applied to legally immigrate to the US to become a permanent resident, how long do you think it would take on average for their application to be approved? Even if you don’t know, please take a guess. For reference, it currently takes spouses of US citizens approximately 12-18 months.”
{ Categories:}
- {Adult Sibling of US Citizen [Correct answer: 3 to 10 years]}
- {Aunt or Uncle of US Citizen [Correct answer: not eligible]}
- {Doctor without a Job Offer [Correct answer: not eligible]}
- {Famous Athlete or Artist [Correct answer: less than 1 year]}
- {Nanny with a Job Offer [Correct answer: 1 to 3 years]}
{ Answer options:}
- Less than 1 year
- 1 to 3 years
- 3 to 10 years
- More than 10 years
- Not eligible
[The answer is considered “Almost correct” if it is adjacent to the correct answer]
{ Information provision experiment}
“You are about to be presented with information. Please take your time and read it carefully. You will be asked questions related to the information afterward. The “Next” button will appear shortly.” [This text is shown before any of the experimental conditions. All treatments have an equal 1/3 chance of being presented.]
- { Placebo Control Condition:} An “immigrant” is a person who comes to a country to take up permanent residence. An “emigrant” is someone who leaves their place of residence or country to live elsewhere. A “migrant” can refer to either an immigrant or an emigrant. “Immigrate” refers to entering a new place; “emigrate” refers to leaving the original place. Migration is defined as a change in a person’s permanent residence from one geographical area to another. International migration consists of people changing residence across countries. Net migration flows to a country are calculated as the difference between (1) immigration to that country and (2) emigration from that country during a particular period of time. If a country has negative net migration flows, it means that more people are leaving than entering that country. If a country has positive net migration flows, it means that more people are entering than leaving that country.
- { Treatment Condition 1 (Burdensome):} The US immigration system is complex and burdensome. There are nearly two hundred different visa types, which makes it difficult to know which visa a potential immigrant can apply for, if any. Applying for a visa is also burdensome in terms of money and waiting time. Application fees and legal consultation costs thousands of dollars. The application fee to become a permanent resident is $1,140 without legal fees. Legal fees for petitioning a spouse of a US citizen to obtain permanent residency, one of the simplest processes, costs around $3,000. Additionally, the average wait time for a visa appointment is 244 days, and some wait over two years. This doesn’t include the time it takes to become eligible for a visa, or for application processing (which can take more than a year depending on the visa type). The difficulty, costs, and long wait times of the immigration process makes it impractical for many.
- { Treatment Condition 2 (Restrictive):} The US immigration system is restrictive. There is a yearly numerical cap of about 220,000 for family-based visa categories and 140,000 for employment-based visas. This means that, if someone received a job offer from a willing employer after the employment-based visa cap was already filled, they would have to wait until at least the next year before being allowed to try immigrating again. Additional restrictions may apply based on immigrant’s country of origin. For example, family members of US citizens from certain countries wait for decades before they can immigrate to become permanent residents. Some foreign workers may also have to wait for decades to obtain permanent residency for which they are otherwise eligible. As of 2022, applicants from the most impacted countries are only now processing applications from the early to mid-2000s because of how restrictive the immigration system is.
{ Immigration policy preferences} (post-treatment) [0-1 index calculated as the average of two items recorded to vary from 0 (the most anti-immigration) to 1 (the most pro-immigration option)]
- “Do you think it should be easier or harder for foreigners to legally immigrate to the United States than it is currently?” [Much harder / Harder / Neither harder nor easier / Easier / Much easier]
- “Do you think the number of legal immigrants from foreign countries who are permitted to come to the United States should be increased a lot, increased a little, decreased a little, or decreased a lot?” [Increased a lot / Increased a little / Neither increased nor decreased / Decreased a little / Decreased a lot]
{ Immigration difficulty beliefs / manipulation checks} (post-treatment) [0-1 index calculated as the average of two items recorded to vary from 0 (immigration is easy) to 1 (immigration is difficult)]
- “How burdensome do you think it is to legally immigrate to the US (in terms of time or money spent on the application process)?” [Very burdensome / A little burdensome / Not very burdensome / Not burdensome at all]
- “Do you think the annual limit on the number of people who can legally immigrate to the US is high or low?” [Very high / A little high / A little low / Very low]
Additional Figures and Tables
Figure: (Positive) Effects of Immigration Policy Information on Beliefs and Preferences. This figure depicts the additional exploratory hypotheses tests for separate treatments and outcome measures. Bars indicate 95%/84% confidence intervals.

Caption: (Positive) Effects of Immigration Policy Information on Beliefs and Preferences. This figure depicts the additional exploratory hypotheses tests for separate treatments and outcome measures. Bars indicate 95%/84% confidence intervals.
Figure: Doubly robust conditional average treatment effect (CATE) function and uniform confidence bands on Immigration Difficulty Beliefs. Estimated using the ‘DRCATE’ stata program. Combined treatment.

Caption: Doubly robust conditional average treatment effect (CATE) function and uniform confidence bands on Immigration Difficulty Beliefs. Estimated using the ‘DRCATE’ stata program. Combined treatment.
Figure: Doubly robust conditional average treatment effect (CATE) function and uniform confidence bands on Immigration Difficulty Beliefs. Estimated using the ‘DRCATE’ stata program. Treatment broken up by ‘Burdensome’ and ‘Restrictive’.

Caption: Doubly robust conditional average treatment effect (CATE) function and uniform confidence bands on Immigration Difficulty Beliefs. Estimated using the ‘DRCATE’ stata program. Treatment broken up by ‘Burdensome’ and ‘Restrictive’.
Figure: Doubly robust conditional average treatment effect (CATE) function and uniform confidence bands on Pro Immigration Beliefs. Estimated using the ‘DRCATE’ stata program. Combined treatment.

Caption: Doubly robust conditional average treatment effect (CATE) function and uniform confidence bands on Pro Immigration Beliefs. Estimated using the ‘DRCATE’ stata program. Combined treatment.
Figure: Doubly robust conditional average treatment effect (CATE) function and uniform confidence bands on Pro Immigration Beliefs. Estimated using the ‘DRCATE’ stata program. Treatment broken up by ‘Burdensome’ and ‘Restrictive’.

Caption: Doubly robust conditional average treatment effect (CATE) function and uniform confidence bands on Pro Immigration Beliefs. Estimated using the ‘DRCATE’ stata program. Treatment broken up by ‘Burdensome’ and ‘Restrictive’.
Table: (Positive) Effects of Immigration Policy Information on Beliefs and Preferences. This table depicts the pre-registered hypotheses tests shown in Figure 1 and the tests with additional pre-treatment controls for greater precision.
\begin{table}[H] \label{tab:demMINI}

\resizebox{0.9\textwidth}{!}{ \begin{tabular}{@{\extracolsep{5pt}}lD{.}{.}{-3} D{.}{.}{-3} D{.}{.}{-3} D{.}{.}{-3} D{.}{.}{-3} D{.}{.}{-3} D{.}{.}{-3} D{.}{.}{-3} } \\[-1.8ex]\hline \hline \\[-1.8ex] & \multicolumn{8}{c}{\textit{Dependent variable:}} \\ \cline{2-9} \\[-1.8ex] & \multicolumn{4}{c}{Believe Immigration is Difficult} & \multicolumn{4}{c}{Pro-Immigration Preference} \\ \\[-1.8ex] & \multicolumn{1}{c}{(1)} & \multicolumn{1}{c}{(2)} & \multicolumn{1}{c}{(3)} & \multicolumn{1}{c}{(4)} & \multicolumn{1}{c}{(5)} & \multicolumn{1}{c}{(6)} & \multicolumn{1}{c}{(7)} & \multicolumn{1}{c}{(8)}\\ \hline \\[-1.8ex] Combined Treatment & 0.062^{***} &  & 0.058^{***} &  & 0.066^{***} &  & 0.067^{***} &  \\ & (0.016) &  & (0.015) &  & (0.018) &  & (0.016) &  \\ Burdensome Treatment &  & 0.056^{**} &  & 0.054^{**} &  & 0.066^{**} &  & 0.073^{***} \\ &  & (0.018) &  & (0.017) &  & (0.020) &  & (0.019) \\ Restrictive Treatment &  & 0.069^{***} &  & 0.062^{***} &  & 0.067^{**} &  & 0.060^{**} \\ &  & (0.018) &  & (0.017) &  & (0.021) &  & (0.019) \\ Policy knowledge (visa almost correct) &  &  & 0.223^{***} & 0.224^{***} &  &  & 0.253^{***} & 0.253^{***} \\ &  &  & (0.051) & (0.051) &  &  & (0.056) & (0.056) \\ Female &  &  & 0.028^{*} & 0.028^{*} &  &  & -0.019 & -0.019 \\ &  &  & (0.014) & (0.014) &  &  & (0.015) & (0.015) \\ Old (40+) &  &  & -0.008 & -0.008 &  &  & -0.113^{***} & -0.114^{***} \\ &  &  & (0.015) & (0.015) &  &  & (0.016) & (0.016) \\ White Non-Hisp. &  &  & 0.033^{*} & 0.033^{*} &  &  & 0.019 & 0.018 \\ &  &  & (0.017) & (0.017) &  &  & (0.018) & (0.018) \\ Spanish-speaking &  &  & 0.020 & 0.019 &  &  & -0.018 & -0.017 \\ &  &  & (0.024) & (0.024) &  &  & (0.026) & (0.026) \\ College-educated &  &  & 0.069^{***} & 0.069^{***} &  &  & 0.051^{**} & 0.052^{**} \\ &  &  & (0.016) & (0.016) &  &  & (0.018) & (0.018) \\ High-income &  &  & 0.047^{*} & 0.047^{**} &  &  & 0.041^{*} & 0.040^{*} \\ &  &  & (0.018) & (0.018) &  &  & (0.020) & (0.020) \\ Independent &  &  & -0.071^{***} & -0.071^{***} &  &  & -0.104^{***} & -0.104^{***} \\ &  &  & (0.016) & (0.016) &  &  & (0.018) & (0.018) \\ Republican &  &  & -0.161^{***} & -0.161^{***} &  &  & -0.211^{***} & -0.211^{***} \\ &  &  & (0.018) & (0.018) &  &  & (0.020) & (0.020) \\ Constant & 0.577^{***} & 0.577^{***} & 0.500^{***} & 0.499^{***} & 0.489^{***} & 0.489^{***} & 0.533^{***} & 0.534^{***} \\ & (0.013) & (0.013) & (0.028) & (0.028) & (0.014) & (0.014) & (0.031) & (0.031) \\ \hline \\[-1.8ex] Observations & \multicolumn{1}{c}{1,000} & \multicolumn{1}{c}{1,000} & \multicolumn{1}{c}{1,000} & \multicolumn{1}{c}{1,000} & \multicolumn{1}{c}{1,000} & \multicolumn{1}{c}{1,000} & \multicolumn{1}{c}{1,000} & \multicolumn{1}{c}{1,000} \\ R$^{2}$ & \multicolumn{1}{c}{0.016} & \multicolumn{1}{c}{0.016} & \multicolumn{1}{c}{0.155} & \multicolumn{1}{c}{0.155} & \multicolumn{1}{c}{0.014} & \multicolumn{1}{c}{0.014} & \multicolumn{1}{c}{0.206} & \multicolumn{1}{c}{0.206} \\ Adjusted R$^{2}$ & \multicolumn{1}{c}{0.015} & \multicolumn{1}{c}{0.014} & \multicolumn{1}{c}{0.146} & \multicolumn{1}{c}{0.146} & \multicolumn{1}{c}{0.013} & \multicolumn{1}{c}{0.012} & \multicolumn{1}{c}{0.198} & \multicolumn{1}{c}{0.197} \\ \hline \hline \\[-1.8ex] \textit{Note:}  & \multicolumn{8}{r}{Standard errors in parentheses} \\ & \multicolumn{8}{r}{$^{*}$p$<$0.05; $^{**}$p$<$0.01; $^{***}$p$<$0.001} \\ \end{tabular} } \caption{\textbf{(Positive) Effects of Immigration Policy Information on Beliefs and Preferences.} This table depicts the pre-registered hypotheses tests shown in Figure 1 and the tests with additional pre-treatment controls for greater precision.} \end{table}
Table: Heterogeneous Treatment Effects on Immigration Difficulty Beliefs. This table depicts the (underpowered) exploratory analyses for possible heterogeneous treatment effects across different subgroups.
\begin{table}[H] \label{tab:demMINI} \resizebox{1\textwidth}{!}{ \begin{tabular}{@{\extracolsep{5pt}}lD{.}{.}{-3} D{.}{.}{-3} D{.}{.}{-3} D{.}{.}{-3} D{.}{.}{-3} D{.}{.}{-3} D{.}{.}{-3} D{.}{.}{-3} D{.}{.}{-3}} \hline \hline \\[-1.8ex] & \multicolumn{9}{c}{\textit{Dependent variable:}} \\ \cline{2-10} \\[-1.8ex] & \multicolumn{9}{c}{Believe Immigration is Difficult} \\ & \multicolumn{1}{c}{Policy} & \multicolumn{1}{c}{Female} & \multicolumn{1}{c}{Old} & \multicolumn{1}{c}{White} & \multicolumn{1}{c}{Spanish-} & \multicolumn{1}{c}{College-} & \multicolumn{1}{c}{High-} & \multicolumn{1}{c}{Party ID} & \multicolumn{1}{c}{Party ID} \\ & \multicolumn{1}{c}{knowledge} & & \multicolumn{1}{c}{(40+)} & \multicolumn{1}{c}{Non-Hisp.} & \multicolumn{1}{c}{speaking} & \multicolumn{1}{c}{educated} & \multicolumn{1}{c}{income} & \multicolumn{1}{c}{(Independent)} & \multicolumn{1}{c}{(Republican)} \\ & \multicolumn{1}{c}{(1)} & \multicolumn{1}{c}{(2)} & \multicolumn{1}{c}{(3)} & \multicolumn{1}{c}{(4)} & \multicolumn{1}{c}{(5)} & \multicolumn{1}{c}{(6)} & \multicolumn{1}{c}{(7)} & \multicolumn{1}{c}{(8)} & \multicolumn{1}{c}{(9)} \\ \hline \\[-1.8ex] Combined Treatment & 0.049^{*} & 0.053^{**} & 0.089^{***} & 0.082^{***} & 0.060^{***} & 0.061^{***} & 0.072^{***} & 0.089^{***} & 0.089^{***} \\ & (0.025) & (0.022) & (0.025) & (0.025) & (0.017) & (0.018) & (0.017) & (0.026) & (0.026) \\ Subgroup & 0.043^{*} & 0.025 & 0.002 & 0.032 & -0.008 & 0.093^{***} & 0.111^{***} & -0.031 & -0.156^{***} \\ & (0.026) & (0.025) & (0.026) & (0.026) & (0.038) & (0.027) & (0.031) & (0.029) & (0.030) \\ Treatment × Subgroup & 0.020 & 0.018 & -0.041 & -0.033 & 0.016 & 0.006 & -0.047 & -0.074^{**} & -0.018 \\ & (0.032) & (0.031) & (0.032) & (0.032) & (0.047) & (0.033) & (0.039) & (0.035) & (0.038) \\ \hline \\[-1.8ex] Observations & \multicolumn{1}{c}{1,000} & \multicolumn{1}{c}{1,000} & \multicolumn{1}{c}{1,000} & \multicolumn{1}{c}{1,000} & \multicolumn{1}{c}{1,000} & \multicolumn{1}{c}{1,000} & \multicolumn{1}{c}{1,000} & \multicolumn{1}{c}{1,000} & \multicolumn{1}{c}{1,000} \\ R$^{2}$ & \multicolumn{1}{c}{0.029} & \multicolumn{1}{c}{0.022} & \multicolumn{1}{c}{0.020} & \multicolumn{1}{c}{0.017} & \multicolumn{1}{c}{0.016} & \multicolumn{1}{c}{0.052} & \multicolumn{1}{c}{0.036} & \multicolumn{1}{c}{0.097} & \multicolumn{1}{c}{0.097} \\ Adjusted R$^{2}$ & \multicolumn{1}{c}{0.026} & \multicolumn{1}{c}{0.019} & \multicolumn{1}{c}{0.017} & \multicolumn{1}{c}{0.014} & \multicolumn{1}{c}{0.013} & \multicolumn{1}{c}{0.049} & \multicolumn{1}{c}{0.033} & \multicolumn{1}{c}{0.093} & \multicolumn{1}{c}{0.093} \\ \hline \hline \\[-1.8ex] \multicolumn{10}{l}{\textit{Note:} Standard errors in parentheses} \\ \multicolumn{10}{l}{* p<0.05, ** p<0.01, *** p<0.001} \\ \end{tabular} } \caption{\textbf{Heterogeneous Treatment Effects on Immigration Difficulty Beliefs}. This table depicts the (underpowered) exploratory analyses for possible heterogeneous treatment effects across different subgroups.} \end{table}
Table: Heterogeneous Treatment Effects on Pro-Immigration Preferences. This table depicts the (underpowered) exploratory analyses for possible heterogeneous treatment effects across different subgroups.
\begin{table}[H] \label{tab:demMINI2} \resizebox{1\textwidth}{!}{ \begin{tabular}{@{\extracolsep{5pt}}lD{.}{.}{-3} D{.}{.}{-3} D{.}{.}{-3} D{.}{.}{-3} D{.}{.}{-3} D{.}{.}{-3} D{.}{.}{-3} D{.}{.}{-3} D{.}{.}{-3}} \hline \hline \\[-1.8ex] & \multicolumn{9}{c}{\textit{Dependent variable:}} \\ \cline{2-10} \\[-1.8ex] & \multicolumn{9}{c}{Pro-Immigration Preference} \\ & \multicolumn{1}{c}{Policy} & \multicolumn{1}{c}{Female} & \multicolumn{1}{c}{Old} & \multicolumn{1}{c}{White} & \multicolumn{1}{c}{Spanish-} & \multicolumn{1}{c}{College-} & \multicolumn{1}{c}{High-} & \multicolumn{1}{c}{Party ID} & \multicolumn{1}{c}{Party ID} \\ & \multicolumn{1}{c}{knowledge} & & \multicolumn{1}{c}{(40+)} & \multicolumn{1}{c}{Non-Hisp.} & \multicolumn{1}{c}{speaking} & \multicolumn{1}{c}{educated} & \multicolumn{1}{c}{income} & \multicolumn{1}{c}{(Independent)} & \multicolumn{1}{c}{(Republican)} \\ & \multicolumn{1}{c}{(1)} & \multicolumn{1}{c}{(2)} & \multicolumn{1}{c}{(3)} & \multicolumn{1}{c}{(4)} & \multicolumn{1}{c}{(5)} & \multicolumn{1}{c}{(6)} & \multicolumn{1}{c}{(7)} & \multicolumn{1}{c}{(8)} & \multicolumn{1}{c}{(9)} \\ \hline \\[-1.8ex] Combined Treatment & 0.083^{***} & 0.062^{**} & 0.048^{*} & 0.081^{***} & 0.074^{***} & 0.061^{***} & 0.082^{***} & 0.087^{***} & 0.087^{***} \\ & (0.029) & (0.026) & (0.028) & (0.028) & (0.019) & (0.021) & (0.020) & (0.028) & (0.028) \\ Subgroup & 0.053^{*} & -0.015 & -0.162^{***} & -0.003 & 0.034 & 0.072^{**} & 0.124^{***} & -0.069^{**} & -0.231^{***} \\ & (0.030) & (0.029) & (0.029) & (0.029) & (0.043) & (0.031) & (0.036) & (0.032) & (0.034) \\ Treatment × Subgroup & -0.027 & 0.008 & 0.042 & -0.023 & -0.064 & 0.017 & -0.076^{*} & -0.070^{*} & -0.012 \\ & (0.037) & (0.036) & (0.036) & (0.036) & (0.054) & (0.038) & (0.045) & (0.039) & (0.043) \\ \hline \\[-1.8ex] Observations & \multicolumn{1}{c}{1,000} & \multicolumn{1}{c}{1,000} & \multicolumn{1}{c}{1,000} & \multicolumn{1}{c}{1,000} & \multicolumn{1}{c}{1,000} & \multicolumn{1}{c}{1,000} & \multicolumn{1}{c}{1,000} & \multicolumn{1}{c}{1,000} & \multicolumn{1}{c}{1,000} \\ R$^{2}$ & \multicolumn{1}{c}{0.018} & \multicolumn{1}{c}{0.014} & \multicolumn{1}{c}{0.073} & \multicolumn{1}{c}{0.015} & \multicolumn{1}{c}{0.015} & \multicolumn{1}{c}{0.034} & \multicolumn{1}{c}{0.029} & \multicolumn{1}{c}{0.137} & \multicolumn{1}{c}{0.137} \\ Adjusted R$^{2}$ & \multicolumn{1}{c}{0.015} & \multicolumn{1}{c}{0.011} & \multicolumn{1}{c}{0.070} & \multicolumn{1}{c}{0.012} & \multicolumn{1}{c}{0.012} & \multicolumn{1}{c}{0.031} & \multicolumn{1}{c}{0.026} & \multicolumn{1}{c}{0.132} & \multicolumn{1}{c}{0.132} \\ \hline \hline \\[-1.8ex] \multicolumn{10}{l}{\textit{Note:} Standard errors in parentheses} \\ \multicolumn{10}{l}{* p<0.05, ** p<0.01, *** p<0.001} \\ \end{tabular} } \caption{\textbf{Heterogeneous Treatment Effects on Pro-Immigration Preferences.} This table depicts the (underpowered) exploratory analyses for possible heterogeneous treatment effects across different subgroups.} \end{table}
Table: Heterogeneous Treatment Effects on Immigration Difficulty Beliefs. This table depicts the exploratory analyses for possible heterogeneous treatment effects across different subgroups and treatment arms.
\begin{table}[H] \label{tab:demMINI3} \resizebox{1\textwidth}{!}{ \begin{tabular}{@{\extracolsep{5pt}}lD{.}{.}{-3} D{.}{.}{-3} D{.}{.}{-3} D{.}{.}{-3} D{.}{.}{-3} D{.}{.}{-3} D{.}{.}{-3} D{.}{.}{-3} D{.}{.}{-3}} \hline \hline \\[-1.8ex] & \multicolumn{9}{c}{\textit{Dependent variable:}} \\ \cline{2-10} \\[-1.8ex] & \multicolumn{9}{c}{Believe Immigration is Difficult} \\ & \multicolumn{1}{c}{Policy knowledge} & \multicolumn{1}{c}{Female} & \multicolumn{1}{c}{Old (40+)} & \multicolumn{1}{c}{White Non-Hisp.} & \multicolumn{1}{c}{Spanish-speaking} & \multicolumn{1}{c}{College-educated} & \multicolumn{1}{c}{High-income} & \multicolumn{1}{c}{Party ID (Independent)} & \multicolumn{1}{c}{Party ID (Republican)} \\ \\[-1.8ex] & \multicolumn{1}{c}{(1)} & \multicolumn{1}{c}{(2)} & \multicolumn{1}{c}{(3)} & \multicolumn{1}{c}{(4)} & \multicolumn{1}{c}{(5)} & \multicolumn{1}{c}{(6)} & \multicolumn{1}{c}{(7)} & \multicolumn{1}{c}{(8)} & \multicolumn{1}{c}{(9)} \\ \hline \\[-1.8ex] Burdensome Treatment & 0.038 & 0.038 & 0.125^{***} & 0.068^{**} & 0.055^{***} & 0.056^{***} & 0.073^{***} & 0.087^{***} & 0.087^{***} \\ & (0.029) & (0.026) & (0.030) & (0.030) & (0.019) & (0.021) & (0.020) & (0.030) & (0.030) \\ Restrictive Treatment & 0.061^{**} & 0.069^{***} & 0.057^{*} & 0.092^{***} & 0.066^{***} & 0.066^{***} & 0.072^{***} & 0.091^{***} & 0.091^{***} \\ & (0.029) & (0.026) & (0.029) & (0.028) & (0.020) & (0.022) & (0.020) & (0.029) & (0.029) \\ Subgroup & 0.043^{*} & 0.025 & 0.002 & 0.032 & -0.008 & 0.093^{***} & 0.111^{***} & -0.031 & -0.156^{***} \\ & (0.026) & (0.025) & (0.026) & (0.026) & (0.038) & (0.027) & (0.031) & (0.029) & (0.030) \\ Burdensome × Subgroup & 0.027 & 0.034 & -0.100^{***} & -0.023 & 0.006 & 0.006 & -0.085^{*} & -0.063 & -0.037 \\ & (0.037) & (0.036) & (0.037) & (0.037) & (0.059) & (0.039) & (0.044) & (0.041) & (0.044) \\ Restrictive × Subgroup & 0.014 & 0.001 & 0.020 & -0.040 & 0.019 & 0.006 & -0.001 & -0.086^{**} & 0.007 \\ & (0.037) & (0.036) & (0.037) & (0.037) & (0.052) & (0.039) & (0.046) & (0.041) & (0.045) \\ \hline \\[-1.8ex] Observations & \multicolumn{1}{c}{1,000} & \multicolumn{1}{c}{1,000} & \multicolumn{1}{c}{1,000} & \multicolumn{1}{c}{1,000} & \multicolumn{1}{c}{1,000} & \multicolumn{1}{c}{1,000} & \multicolumn{1}{c}{1,000} & \multicolumn{1}{c}{1,000} & \multicolumn{1}{c}{1,000} \\ R$^{2}$ & \multicolumn{1}{c}{0.030} & \multicolumn{1}{c}{0.023} & \multicolumn{1}{c}{0.029} & \multicolumn{1}{c}{0.018} & \multicolumn{1}{c}{0.016} & \multicolumn{1}{c}{0.052} & \multicolumn{1}{c}{0.039} & \multicolumn{1}{c}{0.097} & \multicolumn{1}{c}{0.097} \\ Adjusted R$^{2}$ & \multicolumn{1}{c}{0.025} & \multicolumn{1}{c}{0.018} & \multicolumn{1}{c}{0.025} & \multicolumn{1}{c}{0.013} & \multicolumn{1}{c}{0.011} & \multicolumn{1}{c}{0.049} & \multicolumn{1}{c}{0.034} & \multicolumn{1}{c}{0.093} & \multicolumn{1}{c}{0.093} \\ \hline \hline \\[-1.8ex] \multicolumn{10}{l}{\textit{Note:} Standard errors in parentheses} \\ \multicolumn{10}{l}{* p<0.05, ** p<0.01, *** p<0.001} \\ \end{tabular} } \caption{\textbf{Heterogeneous Treatment Effects on Immigration Difficulty Beliefs}. This table depicts the exploratory analyses for possible heterogeneous treatment effects across different subgroups and treatment arms.} \end{table}
Table: Heterogeneous Treatment Effects on Pro-Immigration Preferences. This table depicts the exploratory analyses for possible heterogeneous treatment effects across different subgroups and treatment arms.
\begin{table}[H] \label{tab:demMINI4} \resizebox{1\textwidth}{!}{ \begin{tabular}{@{\extracolsep{5pt}}lD{.}{.}{-3} D{.}{.}{-3} D{.}{.}{-3} D{.}{.}{-3} D{.}{.}{-3} D{.}{.}{-3} D{.}{.}{-3} D{.}{.}{-3} D{.}{.}{-3}} \hline \hline \\[-1.8ex] & \multicolumn{9}{c}{\textit{Dependent variable:}} \\ \cline{2-10} \\[-1.8ex] & \multicolumn{9}{c}{Pro-Immigration Preferences} \\ & \multicolumn{1}{c}{Policy knowledge} & \multicolumn{1}{c}{Female} & \multicolumn{1}{c}{Old (40+)} & \multicolumn{1}{c}{White Non-Hisp.} & \multicolumn{1}{c}{Spanish-speaking} & \multicolumn{1}{c}{College-educated} & \multicolumn{1}{c}{High-income} & \multicolumn{1}{c}{Party ID (Independent)} & \multicolumn{1}{c}{Party ID (Republican)} \\ \\[-1.8ex] & \multicolumn{1}{c}{(1)} & \multicolumn{1}{c}{(2)} & \multicolumn{1}{c}{(3)} & \multicolumn{1}{c}{(4)} & \multicolumn{1}{c}{(5)} & \multicolumn{1}{c}{(6)} & \multicolumn{1}{c}{(7)} & \multicolumn{1}{c}{(8)} & \multicolumn{1}{c}{(9)} \\ \hline \\[-1.8ex] Burdensome Treatment & 0.057^{*} & 0.044 & 0.064^{*} & 0.079^{**} & 0.070^{***} & 0.056^{**} & 0.082^{***} & 0.106^{***} & 0.106^{***} \\ & (0.033) & (0.029) & (0.034) & (0.034) & (0.022) & (0.024) & (0.023) & (0.033) & (0.033) \\ Restrictive Treatment & 0.110^{***} & 0.081^{***} & 0.034 & 0.082^{**} & 0.079^{***} & 0.067^{***} & 0.082^{***} & 0.070^{**} & 0.070^{**} \\ & (0.034) & (0.030) & (0.033) & (0.032) & (0.023) & (0.025) & (0.023) & (0.033) & (0.033) \\ Subgroup & 0.053^{*} & -0.015 & -0.162^{***} & -0.003 & 0.034 & 0.072^{**} & 0.124^{***} & -0.069^{**} & -0.231^{***} \\ & (0.030) & (0.029) & (0.029) & (0.029) & (0.043) & (0.031) & (0.036) & (0.032) & (0.034) \\ Burdensome × Subgroup & 0.012 & 0.042 & 0.023 & -0.020 & -0.035 & 0.040 & -0.081 & -0.100^{**} & -0.018 \\ & (0.042) & (0.041) & (0.042) & (0.043) & (0.067) & (0.044) & (0.051) & (0.045) & (0.049) \\ Restrictive × Subgroup & -0.069 & -0.028 & 0.059 & -0.028 & -0.083 & -0.005 & -0.069 & -0.039 & -0.011 \\ & (0.043) & (0.042) & (0.042) & (0.042) & (0.059) & (0.045) & (0.053) & (0.046) & (0.051) \\ \hline \\[-1.8ex] Observations & \multicolumn{1}{c}{1,000} & \multicolumn{1}{c}{1,000} & \multicolumn{1}{c}{1,000} & \multicolumn{1}{c}{1,000} & \multicolumn{1}{c}{1,000} & \multicolumn{1}{c}{1,000} & \multicolumn{1}{c}{1,000} & \multicolumn{1}{c}{1,000} & \multicolumn{1}{c}{1,000} \\ R$^{2}$ & \multicolumn{1}{c}{0.022} & \multicolumn{1}{c}{0.017} & \multicolumn{1}{c}{0.074} & \multicolumn{1}{c}{0.015} & \multicolumn{1}{c}{0.016} & \multicolumn{1}{c}{0.035} & \multicolumn{1}{c}{0.029} & \multicolumn{1}{c}{0.139} & \multicolumn{1}{c}{0.139} \\ Adjusted R$^{2}$ & \multicolumn{1}{c}{0.017} & \multicolumn{1}{c}{0.012} & \multicolumn{1}{c}{0.069} & \multicolumn{1}{c}{0.010} & \multicolumn{1}{c}{0.011} & \multicolumn{1}{c}{0.030} & \multicolumn{1}{c}{0.024} & \multicolumn{1}{c}{0.132} & \multicolumn{1}{c}{0.132} \\ \hline \hline \\[-1.8ex] \multicolumn{10}{l}{\textit{Note:} Standard errors in parentheses} \\ \multicolumn{10}{l}{* p<0.05, ** p<0.01, *** p<0.001} \\ \end{tabular} } \caption{\textbf{Heterogeneous Treatment Effects on Pro-Immigration Preferences}. This table depicts the exploratory analyses for possible heterogeneous treatment effects across different subgroups and treatment arms.} \end{table}
Pilot Survey Instrument
Figure: Immigration Maze Political Cartoon

Caption: Immigration Maze Political Cartoon
{ Combined Information Treatment} [includes the maze graphic from Figure above]:
\ The US immigration system is complex, burdensome, and restrictive.
There are nearly two hundred different visa types, which makes it difficult to know which visa a potential immigrant can apply for, if any. Applying for a visa is also burdensome in terms of money and waiting time. Application fees and legal consultation costs thousands of dollars. The application fee to become a permanent resident is $1,140 without legal fees. Legal fees for petitioning a spouse of a US citizen to obtain permanent residency, one of the simplest processes, costs around $3,000.
Additionally, the average wait time for a visa appointment is 244 days, and some wait over two years. This doesn’t include the time it takes to become eligible for a visa, or for application processing (which can take more than a year depending on the visa type). The difficulty, cost, and long wait times of the immigration process makes it impractical for many.
There is also a yearly numerical cap of about 220,000 for family-based visa categories and 140,000 for employment-based visas. This means that, if someone received a job offer from a willing employer after the employment-based visa cap was already filled, they would have to wait until at least the next year before being allowed to try immigrating again.
Additional restrictions may apply based on immigrant’s country of origin. For example, family members of US citizens from certain countries wait for decades before they can immigrate to become permanent residents. Some foreign workers may also have to wait for decades to obtain permanent residency for which they are otherwise eligible. As of 2022, applicants from the most impacted countries are only now processing applications from the early to mid-2000s because of how restrictive the immigration system is.
{ Racial resentment} [0-1 index calculated as the average of the following four items, considered high in racial resentment if scored $0.5$]
- Irish, Italian, and Jewish ethnicities overcame prejudice and worked their way up. Blacks should do the same without any special favors.
- Generations of slavery and discrimination have created conditions that make it difficult for blacks to work their way out of the lower class.
- Over the past few years, blacks have gotten less than they deserve.
- It’s really a matter of some people just not trying hard enough: if blacks would only try harder they could be just as well off as whites.
[Strongly agree / Somewhat agree / Neither agree nor disagree / Somewhat disagree / Strongly disagree]
Pre-Registration Analysis Plan
Also available on the Open Science Framework: https://doi.org/10.17605/OSF.IO/XVH8Q
{ {Study Information}}
{ Hypotheses}
H1: Receiving relevant information about the difficulty of legal immigration to the United States will increase respondents’ awareness of this difficulty.
H2: Receiving relevant information about the difficulty of legal immigration to the United States will increase respondents’ support for more open legal immigration policies.
{ {Design Plan}}
{ Study type}
Experiment - A researcher randomly assigns treatments to study subjects, this includes field or lab experiments. This is also known as an intervention experiment and includes randomized controlled trials.
{ Blinding}
Personnel who interact directly with the study subjects (either human or non-human subjects) will not be aware of the assigned treatments. (Commonly known as “double blind”)
{ Is there any additional blinding in this study?}
No response.
{ Study design}
Pre-treatment, the subjects will be asked about their factual knowledge about the issue. Respondents will then be randomly exposed to one of the informational treatments with an encouragement to read it carefully. Post-treatment, respondents will complete a set of immigration preference items and a set of manipulation checks.
The proposed two burdensome and restrictive 150-word treatments build on the publicly available information about various aspects of the immigration process in a form of an accessible, verifiable, and non-judgmental narrative. The burdensome treatment conveys that immigration application and legal fees amount to thousands of dollars and going through the right process takes many years. The restrictive treatment conveys that there is a limited number of immigrant visas available each year and that, depending on one’s origin country, some immigrants may not be able to obtain permanent residency for which they are otherwise eligible. The control/placebo condition mentions policy-neutral facts about immigration. We are agnostic about which information would be more effective. Overall, using simple randomization 1/3 of respondents will be exposed to each of the two treatment conditions plus a further 1/3 of respondents will be exposed to a placebo condition-a text mentioning policy-neutral facts about immigration.
{ Randomization}
We will use simple randomization in which each participant will be randomly assigned to either the control or one of the treatment groups as described above.
{ {Sampling Plan}}
{ Existing Data}
Registration prior to creation of data
{ Explanation of existing data}
As of the date of submission of this research plan for preregistration, the data have not yet been collected, created, or realized.
{ Data collection procedures}
The study will be based on a probability-based, nationally representative survey experiment (N=1000) in a reputable online panel of US adults.
{ Sample size}
1000
{ Sample size rationale}
The sample size of the survey experiment (N = 1000) is determined conservatively based on having a sufficiently high statistical power of 80% to detect a small effect (0.04 on the 0-1 index scale) of providing information treatment on pro-immigration preference index at α = 0.05 for Hypotheses 1 and 2. This assumes, in line with the latest representative 2020 ANES benchmark data, the pro-immigration preference index mean of 0.5 out of 1 with the SD of 0.3 in the control group and a small treatment effect (d = 0.2 or 0.06 on the 0-1 index scale).
{ Stopping rule}
No response
{ {Variables}}
{ Manipulated variables}
The burdensome treatment conveys that immigration application and legal fees amount to thousands of dollars and going through the right process takes many years. The restrictive treatment conveys that there is a limited number of immigrant visas available each year and that, depending on one’s origin country, some immigrants may not be able to obtain permanent residency for which they are otherwise eligible. The control/placebo condition mentions policy-neutral facts about immigration.
Using simple randomization 1/3 of respondents will be exposed to each of the two treatments plus a further 1/3 of respondents will be exposed to a placebo condition-a text mentioning policy-neutral facts about immigration.
{ Measured variables}
Immigration policy preferences (post-treatment): [0-1 index calculated as the average of the following two items] -Do you think it should be easier or harder for foreigners to legally immigrate to the United States than it is currently? [Much harder / Harder / Neither harder nor easier / Easier / Much easier] -Do you think the number of legal immigrants from foreign countries who are permitted to come to the United States should be increased a lot, increased a little, decreased a little, or decreased a lot? [Increased a lot / Increased a little / Neither increased nor decreased / Decreased a little / Decreased a lot]
Manipulation checks / immigration difficulty awareness (post-treatment) [2 units] [0-1 index calculated as the average of the following two items] -How burdensome do you think it is to legally immigrate to the US (in terms of time or money spent on the application process)? [Very burdensome / A little burdensome / Not very burdensome / Not burdensome at all] -Do you think the annual limit on the number of people who can legally immigrate to the US is high or low? [Very high / A little high / A little low / Very low]
{ Indices}
We will create 0-1 indices (calculated as simple averages) for both major dependent variables as described above. Since we are agnostic about which information would be more effective, we will combine the two treatment arms to test our hypotheses.
{ {Analysis Plan}}
{ Statistical models}
Given a random assignment, to test our two main hypotheses we will simply compare the mean values for relevant issue importance indices between the combined treatment and the control/placebo groups.
{ Transformations}
We will create indices for the main outcome variables as described above.
{ Inference criteria}
For all hypotheses, we will use the standard p<.05 criteria for determining if the simple difference-in-means test (between experimental and control groups) suggests that the results are significantly different from those expected if the null hypothesis were correct.
{ Data exclusion}
No screening questions or attention checks will be used to remove respondents.
{ Missing data}
We will exclude all participants who have missing data in any of the main outcome or treatment variables.
{ Exploratory analysis}
We plan to explore the relationship between the outcomes and various sociodemographic and political characteristics of respondents.
Reporting Standards for Experiments
Adapted from our OSF pre-registration plan: https://doi.org/10.17605/OSF.IO/XVH8Q
Hypotheses
H1: Receiving relevant information about the difficulty of legal immigration to the United States will increase respondents’ awareness of this difficulty.
H2: Receiving relevant information about the difficulty of legal immigration to the United States will increase respondents’ support for more open legal immigration policies.
Subjects and Context
{ Data collection procedures}
The study will be based on a probability-based, nationally representative survey experiment (N=1000) in a reputable online panel of US adults.
{ Sample size}
1000
{ Sample size rationale}
The sample size of the survey experiment (N = 1000) is determined conservatively based on having a sufficiently high statistical power of 80 percent to detect a small effect (0.04 on the 0-1 index scale) of providing information treatment on pro-immigration preference index at alpha = 0.05 for Hypotheses 1 and 2. This assumes, in line with the latest representative 2020 ANES benchmark data, the pro-immigration preference index mean of 0.5 out of 1 with the SD of 0.3 in the control group and a small treatment effect (d = 0.2 or 0.06 on the 0-1 index scale).
Allocation Method
Using simple randomization 1/3 of respondents will be exposed to each of the two treatments plus a further 1/3 of respondents will be exposed to a placebo condition-a text mentioning policy-neutral facts about immigration.
Treatments
The proposed two burdensome and restrictive 150-word treatments build on the publicly available information about various aspects of the immigration process in a form of an accessible, verifiable, and non-judgmental narrative. The burdensome treatment conveys that immigration application and legal fees amount to thousands of dollars and going through the right process takes many years. The restrictive treatment conveys that there is a limited number of immigrant visas available each year and that, depending on one’s origin country, some immigrants may not be able to obtain permanent residency for which they are otherwise eligible. The control/placebo condition mentions policy-neutral facts about immigration. We are agnostic about which information would be more effective. Overall, using simple randomization 1/3 of respondents will be exposed to each of the two treatment conditions plus a further 1/3 of respondents will be exposed to a placebo condition-a text mentioning policy-neutral facts about immigration.
Results
{ Statistical models}
Given a random assignment, to test our two main hypotheses we will simply compare the mean values for relevant issue importance indices between the combined treatment and the control/placebo groups.
{ Transformations}
We will create indices (see more information below) for the main outcome variables as described above.
{ Inference criteria}
For all hypotheses, we will use the standard p<.05 criteria for determining if the simple difference-in-means test (between experimental and control groups) suggests that the results are significantly different from those expected if the null hypothesis were correct.
Other Information
{ Measured Outcome Variables}
Immigration policy preferences (post-treatment): [0-1 index calculated as the average of the following two items] -Do you think it should be easier or harder for foreigners to legally immigrate to the United States than it is currently? [Much harder / Harder / Neither harder nor easier / Easier / Much easier] -Do you think the number of legal immigrants from foreign countries who are permitted to come to the United States should be increased a lot, increased a little, decreased a little, or decreased a lot? [Increased a lot / Increased a little / Neither increased nor decreased / Decreased a little / Decreased a lot]
Manipulation checks / immigration difficulty awareness (post-treatment) [2 units] [0-1 index calculated as the average of the following two items] -How burdensome do you think it is to legally immigrate to the US (in terms of time or money spent on the application process)? [Very burdensome / A little burdensome / Not very burdensome / Not burdensome at all] -Do you think the annual limit on the number of people who can legally immigrate to the US is high or low? [Very high / A little high / A little low / Very low]
{ Indices}
We will create 0-1 indices (calculated as simple averages) for both major dependent variables as described above. Since we are agnostic about which information would be more effective, we will combine the two treatment arms to test our hypotheses.